What are dashboards?
Dashboards are a popular information management tool that visually tracks, analyzes, and displays various metrics and helps to make informed decisions. They are a handy method for providing users with the opportunity to view raw data in a more human-readable way, such as a table, line chart, bubble chart, bar chart, and more.
Dashboards can be valuable when you need to:
- access historical data
- analyze numbers in a visual format
- perform a trend analysis to understand what's worked
- monitor specific goals or areas of interest
Dashboards are useful for both salespeople and executives. There is no such thing as a universal dashboard. Every team member has their own goals and list of metrics to track.
Benefits of using dashboards
- Good for tracking multiple metrics and KPIs at once
- Easy to read if correctly set up
- Saves a lot of time, as there is no need to generate reports manually
- Delivers consistent and timely cross-functional communication between members of a team
Metrics categories that are commonly tracked in a retail audit:
- Demographics, like a store's name and address, sales territory, store type, and others. This data will be needed for market analysis and finding out correlations and cross-referencing.
- Product condition, including pictures of the products on the shelves to analyze products’ on-shelf availability (OSA) and their share of shelf at a store, stock level on the shelves to draw attention to the out-of-stock situations, planogram compliance, neighboring products, product damage, retail price, product location, consumer feedback on products. This data may help to identify where staff members need additional training to put your products on shelves as required.
- Trade promotion compliance, including documenting compliance issues with photos, promoted price, product location in a store, product promotions, point of sale materials (POSM) availability, customer feedback on promotions, and others. Trade promotions occupy a large part of CPG companies' marketing budget; therefore, they are interested in tracking promo campaign effectiveness. One of the merchandising representatives' duties is to confirm promo compliance in stores and specify issues.
- Competition, including documenting competitors’ activity and their goods presented in stores, types of promotions by competitors, a list of competitors presented in stores, their products price monitoring, and customer feedback on competitors. With merchandising representatives in stores, it’s easy to monitor what competitors do and how they perform.
- Tracking merchandising reps' activity and efficiency, including their time of arrival and departure, interactions with customers and store managers, and completion of on-site forms. It's a critical task to track how merchandisers perform on-site and see if they are efficient and try their best to do their job.
Dashboards in Inspector Cloud for retail audit
With Inspector Cloud, it’s very easy to analyze the results of merchandising representatives’ work with visual reports and powerful dashboards. On these dashboards, you are able to track performance at specific periods of time, by location, by staff members, and others; and as a result, identify trends and risks, so that you can make informed decisions and take action.
The dashboard functionality is available right from the main page: there, you can select which data should be presented on the dashboard. The data can be presented visually as diagrams, graphs and matrices. You are able to export any dashboard as an .xls file.
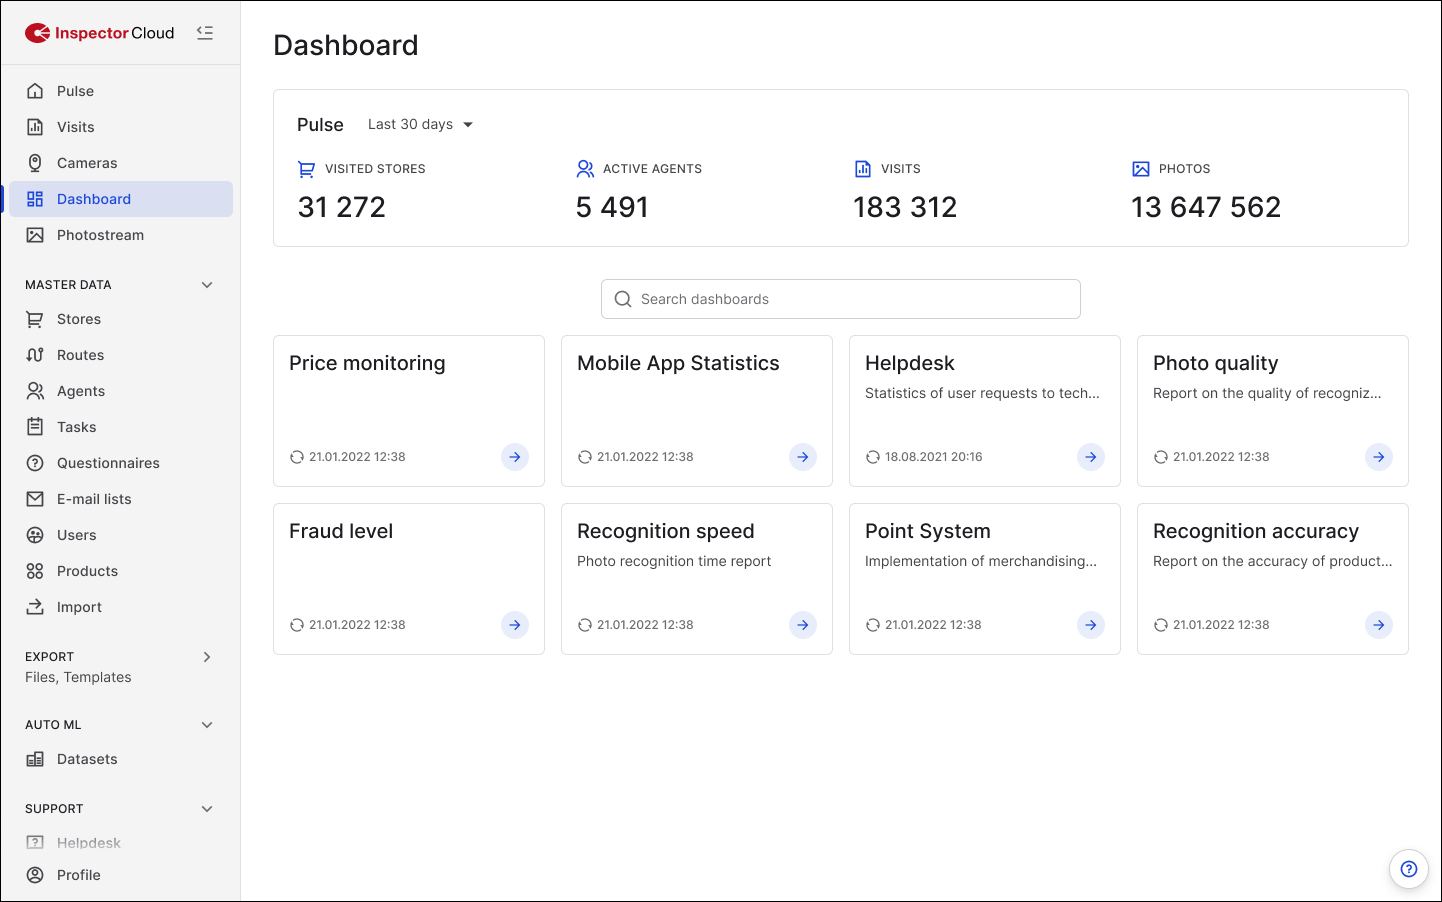
Here are some examples of the reports you can build with Inspector Cloud:
- Number of inspections executed per store
- Number of inspections executed per merchandiser
- Inspection deviation from planned start date
- Filtering by date, store, auditors and checklists